Using infographics for link building
Link building is a task that never ends. We adopt different strategies for getting quality links to our websites. Infographics have been with us for more than eight years now. These graphics have been key drivers in the link building tasks in the past.
MOZ contributor Darren Kingman has posted an analysis he ran to test the effectiveness of infographics in link building process.
Kingman says, “I chose to take a look at Entrepreneur.com as a base for this study, so anyone working with B2B or B2C content, whether in-house or agency-side, will probably get the most use out of this (especially because I scraped the names of journalists publishing this content — shh! DM me for it. Feels a little wrong to publish that openly!).
Here’s how many infographics have been featured as part of an article on Entrepreneur.com over the years:
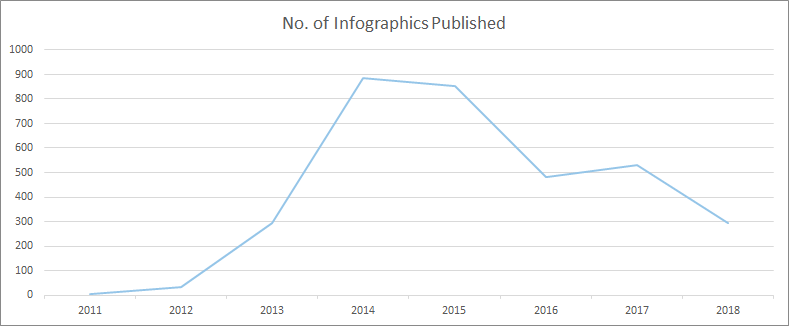
As we’ve not yet finished 2018 (3 months to go at the time this data was pulled), we can estimate the final usage will be in the 380 region, putting it not far from the totals of 2017 and 2016. Impressive stuff in comparison to years gone by”.
Comments are closed.